Replacing Google Analytics with GoAccess
April 2019
Update Feb 2021: the custom GoAccess system I describe below worked well enough, however, I have since switched to GoatCounter.com. It’s simple (but not too simple), and I like Martin’s approach and privacy philosophy.
Google Analytics is a good tool: it’s free, easy to implement, and has served me well over the years. However, partly because I’m not in love with Big Brother Google looking over the shoulder of all my website visitors, and partly because I like experiments in minimalism, I decided to replace Google Analytics on benhoyt.com with a simple analytics setup based on log file parsing.
Log file parsing is an old-skool but effective way of measuring the traffic to your site. It works with or without JavaScript (my version uses a hybrid approach), and doesn’t send any data to Google or other tracking companies.
To do this, I used three main tools:
- Amazon Cloudfront serving a transparent 1x1 pixel image (with logs going to S3)
- A Python script to convert the pixel logs to Apache/nginx “combined log format”
- GoAccess to actually parse the logs and show an analytics report
This article describes why I used this approach and how I implemented it using GoAccess and a tiny bit of custom code.
Cloudfront pixel
My website is a simple and fast static site hosted via GitHub Pages (it’s probably handling a Hacker News traffic spike as you read this ;-). To use GoAccess, I needed a simple way to write to a log file whenever someone requests a page. I decided to use a ping to a pixel.png file hosted on S3 and served via Cloudfront.
So I created a new S3 bucket and uploaded a single transparent 1x1 pixel.png file. Then I created a Cloudfront distribution with logging enabled and pointed it at the S3 bucket (logs go to another S3 bucket).
Finally I added a small code snippet at the bottom of my page template (Cloudfront domain replaced to avoid bots hitting it from here):
<script>
  if (window.location.hostname == 'benhoyt.com') {
    var _pixel = new Image(1, 1);
    _pixel.src = "https://cloudfront.example.net/pixel.png?u=" +
      encodeURIComponent(window.location.pathname) +
      (document.referrer ? "&r=" + encodeURIComponent(document.referrer)
                         : "");
  }
</script>
<noscript>
  <img src="https://cloudfront.example.net/pixel.png?
            u={{ page.url | url_encode }}" />
</noscript>
If JavaScript is enabled, we create an image and point its src to the Cloudfront pixel file, with the URL and referrer encoded in the query string (my log converter will later decode the u and r parameters and output a log line in combined log format).
If JavaScript is disabled, we only have the page URL (no referrer), but at least we can still log the request. Most tracking systems, including Google Analytics, don’t work at all without JavaScript.
Why a pixel versus direct logging?
In some ways it would have been simpler to put Cloudfront in front of GitHub Pages and point my benhoyt.com domain directly to Cloudfront. But I wanted to avoid having to modify DNS and fiddle with the SSL certificate in Cloudfront to prove out the approach.
This does mean I had to write a log conversion script (to decode the u and r parameters in the query string). I may switch to the direct-to-Cloudfront approach later, but in the meantime the pixel-based approach works well, and is easier to change. Plus, writing a few dozen lines of Python is good therapy.
The log converter
So how does the converter script work? It reads Cloudfront log input files, decompresses them, decodes the u and r parameters in the pixel.png query string, and writes the output in combined log format.
One of the things that’s nice about Python is its standard library. There’s a lesser-known package called fileinput which helps you read a bunch of input files line-at-a-time. Quoting from the help, typical use is:
import fileinput
for line in fileinput.input():
    process(line)
This iterates over the lines of all files listed on the command line (or stdin if there are no args). Exactly what you want for a text processing program. It also handles .gz files (like Cloudfront log files) seamlessly with a simple tweak:
finput = fileinput.input(openhook=fileinput.hook_compressed)
Once the script has read a Cloudfront log line and ensured it’s a pixel.png request, it decodes the query string and outputs in combined log format:
# Decode "u" (URL) and "r" (referrer) in query string
path = urllib.parse.unquote(query['u'][0])
referrer = urllib.parse.unquote(query.get('r', ['-'])[0])
try:
    date = datetime.datetime.strptime(fields['date'], '%Y-%m-%d')
except ValueError:
    log_error(finput, 'invalid date: {}'.format(fields['date']))
    continue
user_agent = unquote(fields['cs(User-Agent)'])
ip = fields['c-ip']
if fields['x-forwarded-for'] != '-':
    ip = fields['x-forwarded-for']

# Output in Apache/nginx combined log format
print('{ip} - - [{date:%d/%b/%Y}:{time} +0000] {request} 200 - '
      '{referrer} {user_agent}'.format(
    ip=ip,
    date=date,
    time=fields['time'],
    request=quote('GET ' + path + ' HTTP/1.1'),
    referrer=quote(referrer),
    user_agent=quote(user_agent),
))
The output is a single log file with all the log lines in it. My site is fairly low traffic, so this should be fine for the foreseeable. At some point I’ll write a script to go into S3 and delete old logs.
GoAccess report
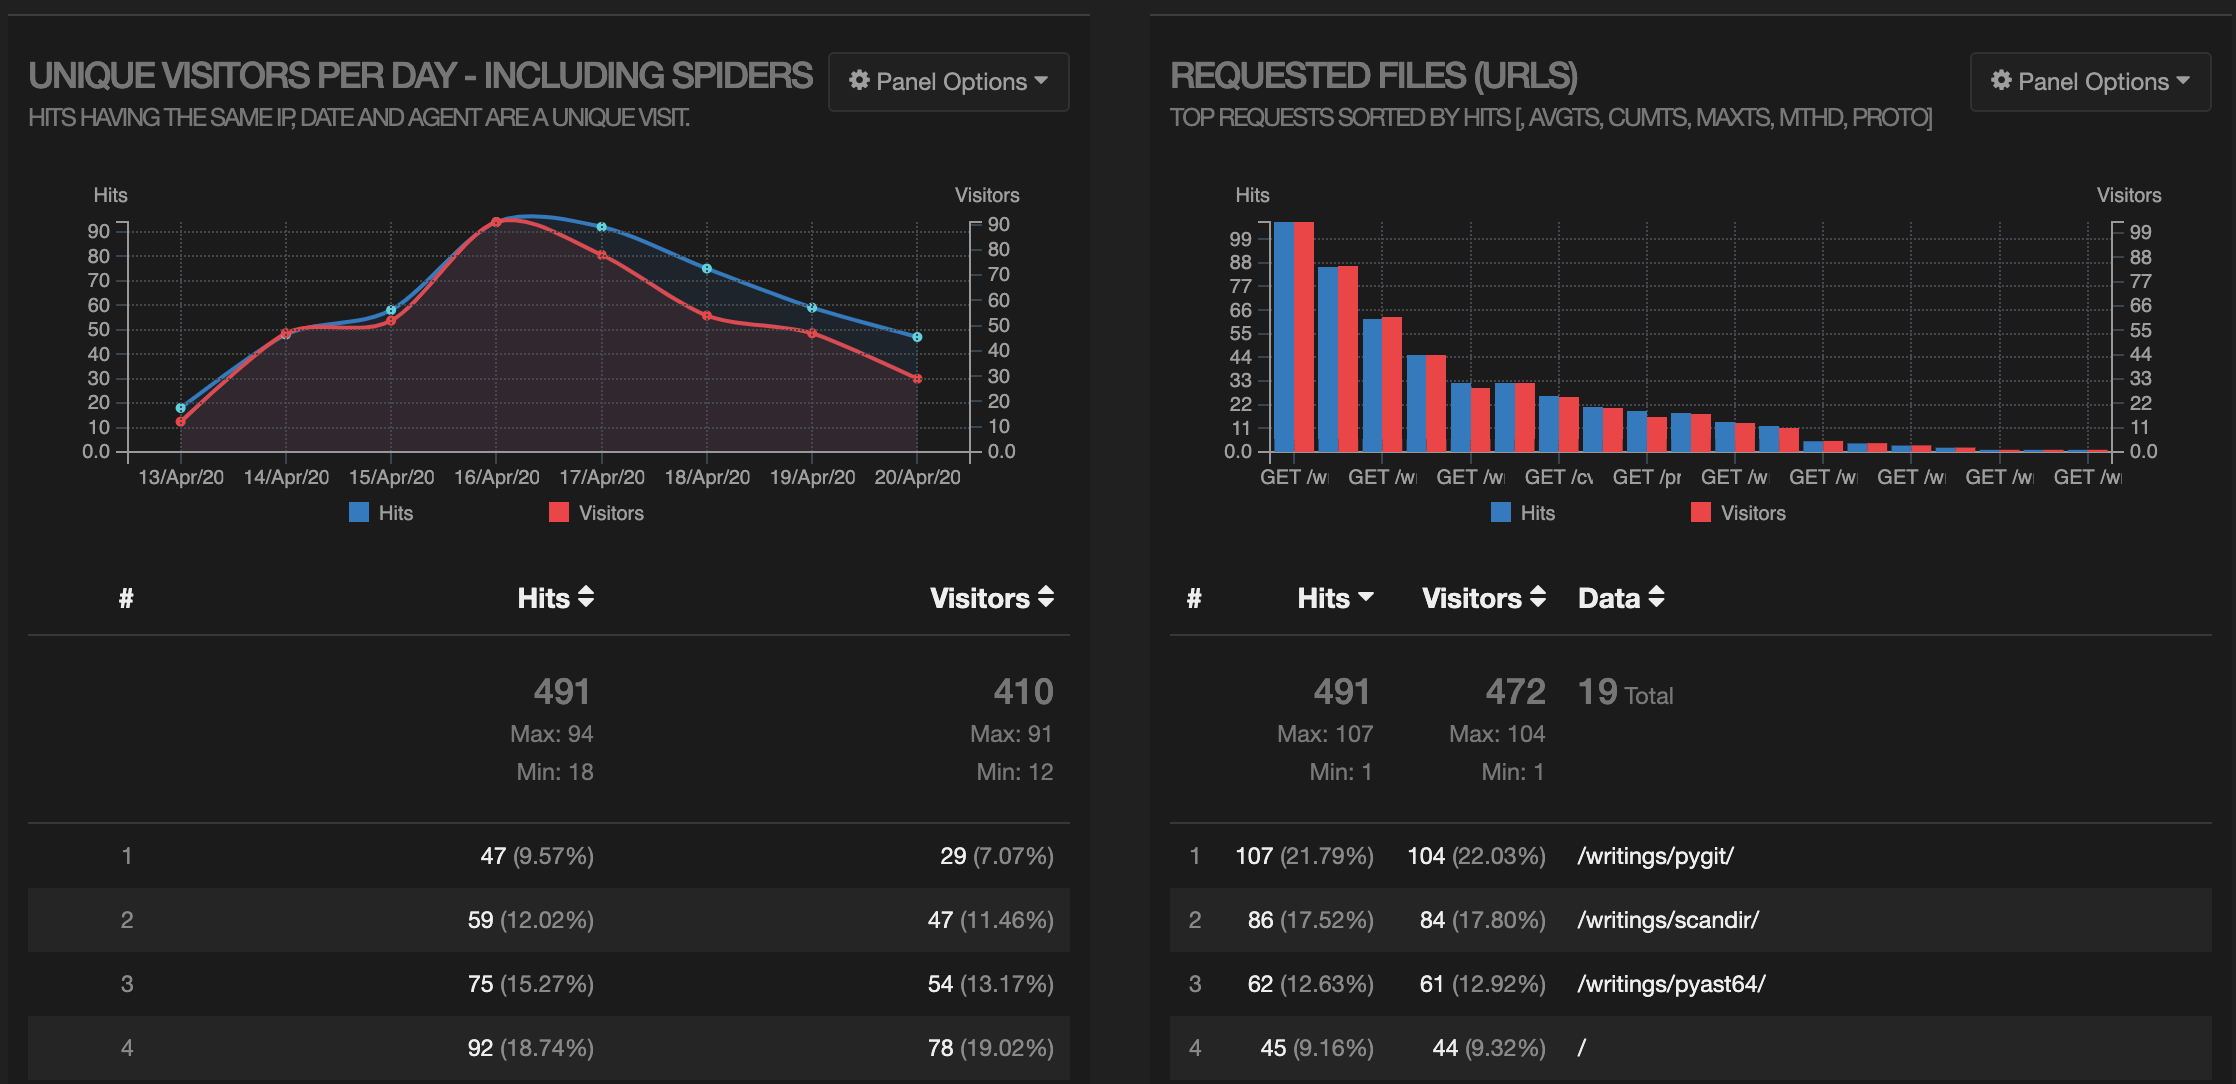
GoAccess is a great little tool that does the actual parsing and presentation of the data. It can be used in the terminal mode, but I prefer to output an HTML report. Here’s a screenshot of the output (showing hits/visitors per day, and hits per URL):

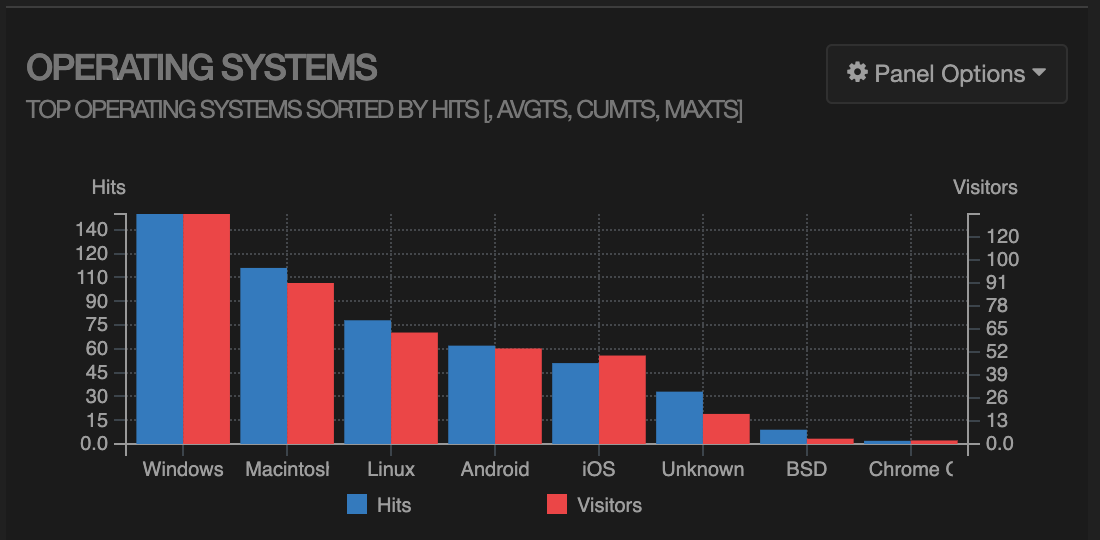
Looks like my articles about pygit and scandir are pretty popular (even though I wrote them a couple of years ago). There’s a bunch more detail, including an operating system breakdown:

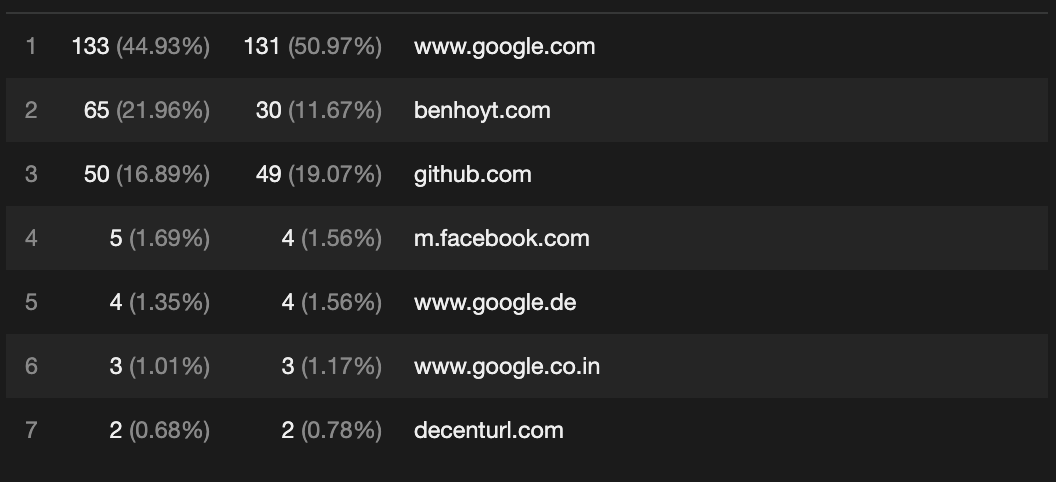
And referring domains:

Obviously with log parsing you don’t get as much information as a JavaScript-heavy, Google Analytics-style system. There’s no screen sizes, no time-on-page metrics, etc. But that’s okay for me! I’m free of the Google, and I had a bit of fun building it.
Feel free to reuse or hack my code:
- cloudfront_to_combined.py log converter
- analytics.sh bash script to drive the process